Since working from home since the 25th of March 2020 I have wondered how my physical activity has been affected. I have worn a Fitbit Charge 2 (most days) since February 2018 so I have a good amount of data to look upon. What I will do is compare total steps for the same period of time for 2020 vs the previous year. I can then see how the average number of steps per day has increased/decreased or any general pattern.
I will be using the Fitbit API via python-fitbit along with Pandas and Matplotlib.
Getting the data
Creating Fitbit App
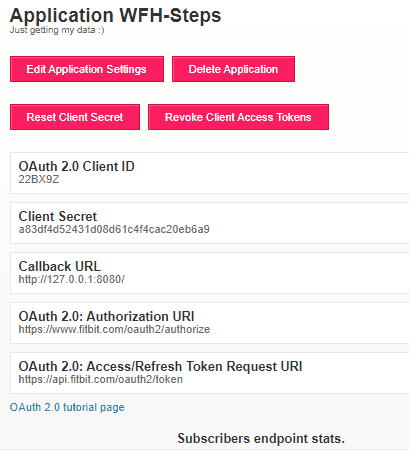
In order to use the Fitbit API you will need to create an app and authorize the Fitbit account that you want to read data from. Go to Fitbit Dev App Registration and register a new app. The callback URL is particularly important. I have used http://127.0.0.1:8080/. This is what the helper script in the Python-Fitbit code expects by default.
Getting Keys via Python-Fitbit Helper
Clone the repo python-fitbit and install the required packages.
pip install -r python-fitbit\requirements\dev.txt
Run the gather keys helper script, passing in your client id and client secret as arguments. This will launch a browser window taking you to a login screen where you can authorize your Fitbit account with your newly created app.
python gather_keys_oauth2.py CLIENT_ID CLIENT_SECRET
Once you have logged in take a note of the data the script will print to the console.
TOKEN
=====
access_token = eyJhbGciOiJIUzI1NiJ9.eyJhdWQiOiIyMkJYOVoiLCJzdWIiOiI2R0NaSksiLCJpc3MiOiJGaXRiaXQiLCJ0eXAiOiJhY2Nlc3NfdG9rZW4iLCJzY29wZXMiOiJyc29jIHJhY3QgcnNldCBybG9jIHJ3ZWkgcmhyIHJudXQgcnBybyByc2xlIiwiZXhwIjoxNjA5Mjk0OTA5LCJpYXQiOjE2MDkyNjYxMDl9.0Q8VdtKNrQeXLJ2fx1kGO993BmTCA9ncRykBnawZL-0
expires_in = 28800
refresh_token = b051486632f8c6eb30ba9fc6b7ac9b0b6f2ea2cbf6d1fe0770d9baad7151cfd3
scope = ['heartrate', 'nutrition', 'weight', 'activity', 'sleep', 'settings', 'location', 'social', 'profile']
token_type = Bearer
user_id = 6GCZJK
expires_at = 1609294914.5506968
You will need to copy the access_token and refresh_token.
Using the Fitbit python library
To get all the data I need I do the following.
f = fitbit.Fitbit(client_id, client_secret, access_token=access_token, refresh_token=refresh_token)

march2019 = "2019-03-25"
november2019 = "2019-11-25"
march2020 = "2020-03-25"
november2020 = "2020-11-25"

fdata2019 = f.time_series(STEP_ACTIVITY, base_date=march2019, end_date=november2019)["activities-steps"]
fdata2020 = f.time_series(STEP_ACTIVITY, base_date=march2020, end_date=november2020)["activities-steps"]
I want to get the data in an easier form for me to work with, so I create some simple helper functions.
def parse_datetime(date_string, fmt="%Y-%m-%d"):
    return datetime.strptime(date_string, fmt)

def parse_fitbit_data(fitbit_data):
    """
    Converts number of steps to int and parses string datetime.
    Adds day and month names.
    """
    new_fitbit_data = []
    for day in fitbit_data:
        d = {}
        d["datetime"] = parse_datetime(day["dateTime"])
        d["steps"] = int(day["value"])
        d["day"] = calendar.day_name[d["datetime"].weekday()]
        d["dayofweek"] = d["datetime"].weekday()
        d["month"] = calendar.month_name[d["datetime"].month]
        new_fitbit_data.append(d)
    return new_fitbit_data
I can then parse the data returned by the Fitbit API and create a single Pandas DataFrame.
data2019 = parse_fitbit_data(fdata2019)
data2020 = parse_fitbit_data(fdata2020)

df2019 = pandas.DataFrame(data2019).set_index('datetime')
df2020 = pandas.DataFrame(data2020).set_index('datetime')

df = pandas.concat([df2019, df2020])
In [13]: df
Out[13]:
            steps        day  dayofweek     month
datetime
2019-03-25   9167     Monday          0     March
2019-03-26   9176    Tuesday          1     March
2019-03-27  14875  Wednesday          2     March
2019-03-28   8012   Thursday          3     March
2019-03-29  13021     Friday          4     March
...           ...        ...        ...       ...
2020-11-21  10050   Saturday          5  November
2020-11-22   6444     Sunday          6  November
2020-11-23  11155     Monday          0  November
2020-11-24  12731    Tuesday          1  November
2020-11-25  12889  Wednesday          2  November

[492 rows x 4 columns]
I now just need to aggregate the steps, grouping by day of the week.
mean_steps_df = df.groupby([df.index.map(lambda x: x.year), 'dayofweek']).mean()
mean_steps_df['steps'] = mean_steps_df['steps'].astype(int)
I want to use the actual days of the week names rather than a number, so for that I need to modify the dataframe's index. I am sure there is a nicer way to achieve this.
mean_steps_df.index = pandas.MultiIndex(levels=[mean_steps_df.index.levels[0], calendar.day_name],
                                        codes=mean_steps_df.index.codes,
                                        names=mean_steps_df.index.names)
In [24]: mean_steps_df
Out[24]:
                    steps
datetime dayofweek
2019     Monday      7318
         Tuesday     6700
         Wednesday   7608
         Thursday    8610
         Friday     11735
         Saturday   13289
         Sunday      9680
2020     Monday     13104
         Tuesday    13001
         Wednesday  11705
         Thursday   12471
         Friday     15115
         Saturday   12089
         Sunday     12795
Analysing
ax = mean_steps_df.unstack(0).plot(kind='bar', grid=True, rot=20)
ax.set_xlabel('Day')
ax.set_ylabel('Steps')
ax.set_title('Average Number of Steps Per Day')
ax.legend(['2019','2020'])
ax.grid(alpha=0.33)
plt.savefig('steps_2019vs2020_patrickmcmichael.png')
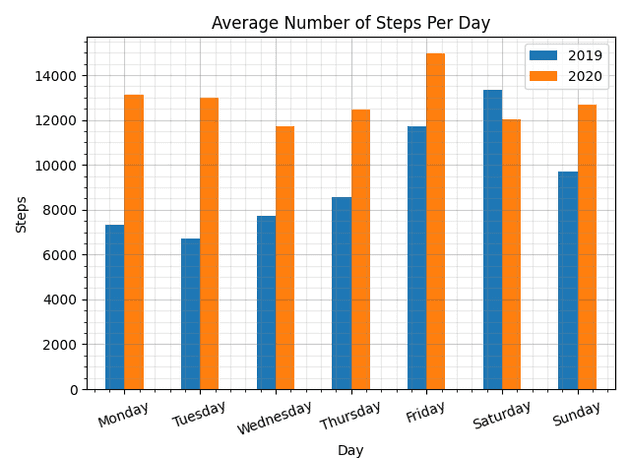
This really shows the number of steps on weekdays dramatically increased. Why is this? I think the main reason is because as I have been temporarily working from home it means I no longer have to commute. My previous commute was driving 110+ miles per day so a large part of the day outside of work was spent sitting in a car. When I returned home in the evening, I normally felt pretty drained after the long car journey. It meant I didn't have the desire to be active rather I was more content with resting.
Now when I finish work, I still have plenty of energy and desire to exercise (go for walk, treadmill etc).
Interestingly, the number of steps has actually decreased for Saturday. I suggest this is because I get slightly more sleep on that day. And, unlike in 2019 I have no desire to "make up" for lack of exercise on the preceding weekdays.
Steps Per Month
I can quickly get the data per month instead of per day to say if there any patterns. This is a bit annoying since I need to reorder the months as they will be alphabetical by default. I also will use the aggregate the steps by using the sum rather than the mean.
mean_steps_month_df = df.groupby([df.index.map(lambda x: x.year), 'month']).sum()
mean_steps_month_df['steps'] = mean_steps_month_df['steps'].astype(int)
mean_steps_month_df = mean_steps_month_df['steps']

months = [month for month in month_name if month in mean_steps_month_df.unstack(0).index.values]
ax2 = mean_steps_month_df.unstack(0).reindex(months).plot(kind='bar', grid=True, rot=20)
ax2.set_xlabel('Month')
ax2.set_ylabel('Steps')
ax2.set_title('Total Number of Steps Per Month')
ax2.legend(['2019','2020'])
ax2.grid(alpha=0.33)

plt.grid(b=True, which='major', color='#666666', linestyle='-')

plt.minorticks_on()
plt.grid(b=True, which='minor', color='#999999', linestyle='-', alpha=0.2)

plt.tight_layout()
plt.savefig('steps2019vs2020months.png')
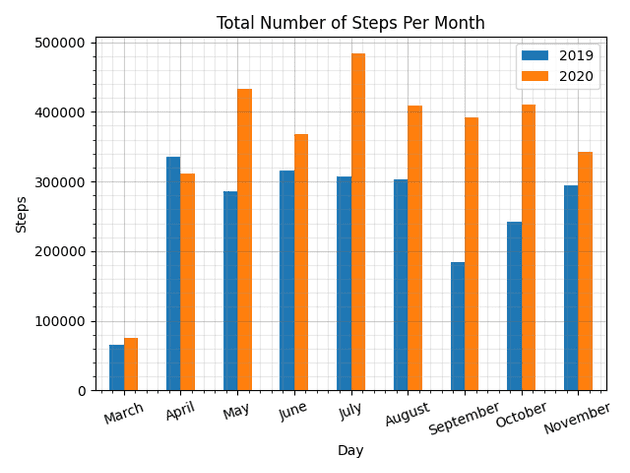
Surprisingly, for April I did more steps in 2019 than in 2020. So, I did not necessarily increase the number of steps right away.
Conclusion
When I had to work from home due to Covid-19 I did consider not having the commute would benefit me hugely. Long commutes make you fat, tired, and miserable (VOX, 2015) is an interesting article which shows the negative effects on people who have longer commutes.
For me, the long commute was also not always bad. The journey to work forced me to wake up and "ease in" to the day rather than sit down at a desk straight away. I often listened to audiobooks or podcasts which passed the time. The journey home was less pleasant as it took longer, and I was already tired from working for the previous seven or eight hours.
You can look at the code I have used on this GitHub Gist.


